Chapter 18:
Financial Condition
18.0 Introduction
The public expects much of its elected officials in local government, who in many cases assume their positions facing a steep learning curve on a wide range of complex issues. A critical part of this learning curve involves financial management, where elected officials possess the ultimate responsibility for the fiscal matters of their organizations. (See G.S. 153A-101 for counties and G.S. 160A-67 for municipalities). To carry out this responsibility, the law requires an annual independent audit of each local government unit’s financial statements and requires that an auditor be selected by and report directly to the unit’s governing board. [G.S. 159-34(a)]. One goal of this process is for the locality to receive an “unmodified audit opinion,” meaning that its financial statements were prepared in conformity with generally accepted accounting principles (GAAP) and present, in all material respects, the financial position of the organization. Another goal is to analyze and interpret the financial statements to determine the financial condition of the local government.
Administrators play an extremely important role in helping elected officials manage the fiscal matters of local governments. They ensure that professional management practices are used to budget and account for the financial resources of the organization, to prepare monthly financial reports for elected officials to review budget-to-actual variances, and to ensure that annual financial statements are prepared in conformity with GAAP. Administrators also play an extremely important role in helping elected officials understand the financial condition of the respective local government. The purpose of this policy is to present administrators with an approach for analyzing, interpreting, and communicating financial condition to elected officials. It begins by defining financial condition—responding to the lack of agreement on this concept in our profession—before presenting the criteria that were identified for creating the approach to evaluating financial condition. It then describes how the approach relates to the financial-reporting model, the dimensions and the indicators that were selected to measure financial condition, the ability to communicate financial condition to elected officials through trend analysis and benchmarking, and additional indicators used by the Local Government Commission (LGC).
18.1 Defining Financial Condition
The definitions of “financial condition” in the professional literature are either specific in nature or broad in scope. Therefore, in search of middle ground, we turned to the work of Robert Berne and Richard Schramm to guide our approach for evaluating financial condition. [See THE FINANCIAL ANALYSIS OF GOVERNMENTS (1986)]. These scholars maintain that there are two basic reasons for the way resources are presented in financial statements: to report on the flow of resources during a given period and to report on the stock of resources at a given point. Operating statements report on the inflow and outflow of financial resources during the fiscal year. Balance sheets report on the stock of assets, liabilities, and net position or fund balances at the end of the fiscal year. We concluded that a logical definition of financial condition would align with resource flow and stock as reported in the annual financial statements.
Berne offers a definition that is closely related to the concept of resource flow and stock: the probability that a government will meet, currently and in the future, (1) its financial obligations to creditors, consumers, employees, taxpayers, suppliers, constituents, and others as they become due and (2) its service obligations to constituents. [See Robert Berne, Measuring and Reporting Financial Condition, in HANDBOOK OF PUBLIC ADMINISTRATION 332, 333–35 (James L. Perry, ed., 2nd ed. 1996)]. The probability that a local government can meet these obligations, as interpreted from financial statements, increases with adequate resource flow to meet current obligations and with adequate resource stock to meet obligations over time.
An implied but missing element of Berne’s definition is provision of capital assets. In response to this and other considerations, we offer the following definition of financial condition: a local government’s ability to meet its ongoing financial, service, and capital obligations based on the status of resource flow and stock as interpreted from its annual financial statements. Although a local government’s ability to meet its ongoing financial, service, and capital obligations is broad in scope, the specific focus of our definition is how a local government’s ability to meet them aligns with resource flow and stock as interpreted from the annual financial statements.
18.2 Criteria for Analyzing Financial Condition
Parallel to the situation with defining financial condition, our profession does not have an agreed-on approach for analyzing, interpreting, and communicating financial condition in local government. Again, the approaches that exist are either specific in nature or broad in scope. Because of the broad continuum of current methods for evaluating financial condition in local government, the approach contained in this policy is based on the following criteria: systematic, comprehensive, flexible, comparable, and manageable.
Designing a systematic approach to evaluating a local government unit’s financial condition was paramount, given the expanded financial-reporting model created by GASB Statement No. 34, Basic Financial Statements—and Management’s Discussion and Analysis—for State and Local Governments. More specifically, the approach had to (1) systematically evaluate the financial condition of the organization as reported in government-wide statements and (2) systematically evaluate the financial condition of each major fund. The approach also had to be comprehensive, providing a thorough analysis of resource flow and stock at the government-wide and fund levels of the organization. The focus on resource flow and stock supported our definition of financial condition.
The criterion of flexibility acknowledged that administrators might want to augment this approach with additional financial indicators or even replace a financial indicator with another. Comparability was one of the primary reasons for the passage of GASB Statement No. 34. Calculating a financial indicator like the quick ratio at one point would provide only limited information. Calculating it over time for trend analysis and benchmarking it against other local governments would provide the necessary context for interpreting the results. The reality is that evaluating financial condition is relative, requiring comparative information for analyzing, interpreting, and communicating it to elected officials.
Evaluating financial condition also had to be manageable. Local governments of all sizes had to be able to implement this approach accurately from financial data taken from their annual financial statements—consistent with our definition of financial condition—and had to have the organizational resources to manage it over time. Another important aspect of this criterion was the ability to use our approach successfully to communicate financial condition to elected officials. Doing so would require a careful balance of financial indicators selected for the evaluation. If the approach relied on a limited number of financial indicators, then communicating a comprehensive analysis to elected officials would not be possible. If the approach relied on too many financial indicators, then communicating the analysis would be unwieldy.
18.3 Financial Reporting Model
Elected officials must have a basic understanding of three important aspects of the financial reporting model as shown in Figure 18.1 before they can be expected to use financial condition information effectively. First, financial statements in local government have two levels of reporting: the government-wide level and the fund level. Second, financial statements for government-wide activities and enterprise funds measure economic resources using the accrual basis of accounting, whereas financial statements for governmental funds measure financial resources using the modified accrual basis of accounting. Third, all North Carolina counties and municipalities are required to have a general fund, which is the main operating fund and one of several potential governmental funds. However, not all local governments have enterprise funds, which are used to account for the resource flow and stock of utilities (for example, water, wastewater, electricity, and natural gas).
Figure 18.1. Revised Financial-Reporting Model for Analysis of Financial Condition
| Financial Statement Reporting Level | Activity Type (Resources Measured) | |
| Government-Wide Level | Governmental Activities (Economic Resources) | Business-Type Activities (Economic Resources) |
| Fund Level | Governmental Funds (Financial Resources) | Enterprise Funds (Economic Resources) |
Figure 18.1 does not contain fiduciary funds because the resources accounted for in pension trust, investment trust, private-purpose trust, and custodial funds are owned by parties other than the local government. Figure 18.1 also does not contain internal service funds, one of the two types of proprietary funds (the other type being enterprise funds), because they inherently create redundancy in financial reporting. To overcome this problem, the accumulated resources of these funds are disbursed back to either governmental activities or business-type activities at the end of the fiscal year based on which group of activities used them the most. The profits or losses of these funds are then divided between governmental activities and business-type activities based on actual use.
We acknowledge that local governments may want to use our approach to evaluate the financial condition of selected internal service funds on a case-by-case basis. Internal service funds that account for activities like fleet services may be appropriate for this form of analysis. An actuarial analysis may be more appropriate for internal service funds that account for activities like health benefits, given the known and unknown risks involved with them.
18.4 Evaluating Economic Resources
We selected four financial dimensions and four financial indicators for evaluating resource flow for government-wide activities and enterprise funds, as shown in Table 18.1. The first dimension, inter-period equity, addresses whether a government lived within its means during the fiscal year. The total margin ratio indicator is used to evaluate this dimension. It represents the total inflow of resources divided by the total outflow of resources for government-wide activities and for enterprise funds. A ratio of 1.0 or higher indicates that the government lived within its means for the respective activity or fund. For government-wide activities, resource inflow includes the net of transfers in and out between governmental activities and business-type activities. For the enterprise funds, transfers in from other funds are included as resource inflow and transfers out to other funds are included as resource outflow. These assumptions are consistent with the GAAP reporting format.
Whereas the total margin ratio analyzes the relationship between total resources available and total resources consumed, the financial indicator of percentage change in net position, used to evaluate our second financial dimension, financial performance, provides feedback on the extent to which a government’s net position improved or deteriorated because of resource flow. A positive percentage change indicates that the government’s financial position improved from the resource flow that occurred during the fiscal year. Periodic modest fluctuations are generally expected. Fluctuations that are significant in nature (in either direction) should be obvious and evaluated accordingly.
The financial dimension of self-sufficiency addresses the extent to which the government used service charges to cover total expenses. This dimension is especially important to business-type activities and to enterprise funds, for which the goal often is to cover total expenses on a charge-for-service basis. The charge-to-expense ratio indicator is used to analyze this dimension. A ratio of 1.0 or higher indicates that the activity or fund was self-sufficient. An argument could be made that this financial dimension is not applicable for governmental activities because governmental services with public-good characteristics are not designed to be self-supporting. However, elected officials and administrators often are interested in the mix between general taxation and user-fee revenue when preparing and adopting budgets for the forthcoming fiscal year. To this end, the financial indicator calculation does not include grants and contributions, which are an inherent part of program revenues in the government-wide financial statements.
Our final dimension for resource flow for government-wide activities and enterprise funds is financing obligation. This dimension is analyzed with the debt-service ratio indicator, which is calculated by dividing annual debt service of principal and interest payments by total expenses plus principal. Because of their measurement focus, both government-wide activities and enterprise funds do not report principal repayments on debt as an expense. To achieve a proper calculation of this debt-service ratio, the principal amounts must be included in both the numerator and the denominator. The purpose of this ratio is to provide feedback on service flexibility, which decreases as more resources are committed to annual debt service.
Table 18.1. Resource Flow for Governmental Activities and Enterprise Funds—Operating Statement (Economic Resources and Accrual Basis of Accounting)
| Financial Dimension | Description | Financial Indicator | Governmental Activities | Enterprise Funds | ||
| Calculation | Data Source | Calculation | Data Source | |||
| Inter-period Equity | Addresses whether or not a government lived within its financial means during the fiscal year . | Total margin ratio | Total resource inflow (program revenues plus total general revenues and net transfers) divided by total resource outflow (total expenses) | Statement of activities | Total resource inflow (operating and non-operating revenues plus transfers in) divided by total resource outflow (operating and non-operating expenses plus transfers out) | Statement of revenues, expenses, and changes in fund net position |
| Financial performance | Provides the magnitude of how a government’s financial position improved or deteriorated as a result of resource flow . | Percentage change in net position | Change in net position divided by net position, beginning | Statement of activities | Change in net position divided by net position, beginning | Statement of revenues, expenses, and changes in fund net position |
| Self-sufficiency | Addresses the extent to which service charge revenues covered total expenses . | Charge to expense ratio | Charges for services (fees, fines, and charges for services) divided by total expenses | Statement of activities | Charges for services divided by operating and non-operating expenses | Statement of revenues, expenses, and changes in fund net position |
| Financing obligation | Provides feedback on service flexibility with the amount of expenses committed to annual debt service . | Debt service ratio | Debt service (principal and interest payments on long-term debt) divided by total expenses plus principala | Statement of activities b | Debt service (principal and interest payments on long-term debt) divided by operating and nonoperating expenses plus principalc | Statement of revenues, expenses, and changes in fund net positiond |
a . Principal is added to the denominator because it is not included in expenses .
b . Interest payments on long-term debt for governmental activities are located on the statement of activities . Principal payments on long- term debt for governmental activities are located in the notes of financial statements .
c . Principal is added to the denominator because it is not included in expenses .
d . Interest payments on long-term debt for enterprise funds are located on the statement of revenues, expenses, and changes in fund net position. Principal payments on long-term debt for enterprise funds are located on the statement of cash flows or in the notes of financial statements.
We selected four financial dimensions and four financial indicators for evaluating resource stock for government-wide activities and enterprise funds as shown in Table 18.2. An advantage of the stock indicators over the flow indicators is that they tend to be more recognizable in the profession because they are associated with the balance sheet, which more often is used to evaluate financial condition in the public and private sectors. In other words, balance sheets report on equity, or net position, at a given point.
Liquidity is the financial dimension used to analyze an organization’s ability to meet short-term obligations. It is calculated with the quick ratio indicator: cash and investments divided by current liabilities. A high ratio suggests that the government is more likely to meet its short-term obligations. Solvency, on the other hand, is the financial dimension used to analyze an organization’s ability to meet long-term obligations. It is calculated with the net position ratio indicator: unrestricted net position divided by total liabilities. As with the quick ratio, a high ratio suggests that the government is more likely to meet long-term obligations.
Some advocate using total assets as the denominator for the net position ratio calculation rather than total liabilities. We believe that standardizing unrestricted net position with total liabilities provides a stronger indication of an organization’s ability to meet long-term obligations. Furthermore, we believe that restricted net assets should not be a part of this equation because such assets are typically not directly related to an entity’s ability to meet current or long-term obligations.
Leverage is the financial dimension that addresses the extent to which total assets are financed with long-term debt. The financial indicator used to analyze this dimension is the debt-to-assets ratio: long-term debt divided by total assets. If a government becomes too reliant on debt financing to secure capital assets, it may compromise service flexibility as it commits more resource flow to annual debt-service obligations. An overreliance on debt also may have unfavorable implications for bond ratings.
This financial indicator may present challenges for North Carolina counties because school debt is included on their financial statements and the value of school infrastructure financed with that debt is not. One approach to getting around this problem is to use the flexibility criterion (see Section 18.2 above), eliminating or replacing the debt-to-assets ratio. The preferred approach is to calculate the indicator based on the data contained in the financial statements, footnoting the discrepancy for the reader. The reality is that counties are responsible for school debt but do not own the related infrastructure.
Capital, the final financial dimension of resource stock for government-wide activities and enterprise funds, is used to analyze the condition of capital assets as defined by their remaining useful life. The financial indicator to measure this dimension is the capital-assets-condition ratio. The data used for this calculation are in the capital assets section of the notes to financial statements. To calculate the indicator, accumulated depreciation is first divided by capital assets subject to depreciation. The resulting percentage is then subtracted from 1.0, which results in the remaining useful life of the total capital assets being depreciated. A high ratio suggests that a government is investing in its capital assets.
Table 18.2. Resource Stock for Governmental Activities and Enterprise Funds—Balance Sheet (Economic Resources and Accrual Basis of Accounting)
| Financial Dimension | Description | Financial Indicator | Governmental Activities | Enterprise Funds | ||
| Calculation | Data Source | Calculation | Data Source | |||
| Liquidity | Government’s ability to address short-term obligations | Quick ratio | Cash and investments divided by current liabilitiesa | Statement of net position | Cash and investments divided by current liabilities b | Statement of net position— proprietary funds |
| Solvency | Government’s ability to address long-term obligations | Net position ratio | Unrestricted net position divided by total liabilities c | Statement of net position | Unrestricted net position divided by total liabilities | Statement of net position— proprietary funds |
| Leverage | Extent to which total assets are financed with long-term debt | Debt to assets ratio | Long-term debt divided by total assets | Statement of net position | Long-term debt divided by total assets | Statement of net position— proprietary funds |
| Capital | Condition of capital assets as defined by remaining useful life | Capital assets condition ratio | 1– .0 (accumulated depreciation divided by capital assets being depreciated) | Statement of net position or notes to financial statements | 1– .0 (accumulated depreciation divided by capital assets being depreciated) | Statement of net position or notes to financial statements |
a . Restricted cash is not part of cash and investments for this calculation . This ratio also excludes the current portion of compensated balances from current liabilities . Another potential exclusion is bond anticipation notes . The current portion of long-term debt is included .
b . Restricted cash is not part of cash and investments for this calculation . This ratio also excludes the current portion of compensated balances from current liabilities . Another potential exclusion is bond anticipation notes . The current portion of long-term debt is included . It should be noted that the Local Government Commission uses a different ratio for calculating the current ratio for enterprise funds— current assets (less inventory and prepaid expenses) are divided by current liabilities .
c . The value of unrestricted net position for governmental activities is often negative for North Carolina counties because the value of school assets financed with county debt is not included on the statement of net position . While the interpretation of the financial indicator remains the same, it should be footnoted for explanation .
18.5 Evaluating Financial Resources
We selected three financial dimensions and three financial indicators for evaluating resource flow for governmental funds as shown in Table 18.3. This evaluation applies primarily to the general fund. At times, a local government may want to analyze the financial condition of special revenue funds, debt service funds, capital project funds, or permanent funds. Our indicators may be used to evaluate the financial condition of these funds. However, we propose that they be captured as part of governmental activities unless a local government has a specific reason for disaggregating them. For example, a local government may have a major special revenue fund that it wants to disaggregate, given the amount of resources involved or the importance of services and activities being accounted for in the fund.
Table 18.3. Resource Flow for General Fund—Operating Statement (Financial Resources and Modified Accrual Basis of Accounting)
| Financial Dimension | Description | Financial Indicator | Calculation | Data Source | |
| Service obligation | Addresses whether a government’s annual revenues were sufficient to pay for annual operations . | Operations ratio | Total revenues divided by total expenditures (plus transfers to debt service fund and less proceeds from capital leases and installment purchases) | Statement of revenues, expenditures, and changes in fund balances | |
| Dependency | Provides the extent to which a government relies on other governments for resources . | Intergovernmental ratio | Total intergovernmental revenue divided by total revenuea | Statement of revenues, expenditures, and changes in fund balances | |
| Financing obligation | Provides feedback on service flexibility with the amount of expenditures committed to annual debt service . | Debt service ratio | Debt service (principal and interest payments on long- term debt, including transfers to the debt service fund) divided by total expenditures (plus transfers to debt service fund and less proceeds from capital leases and installment purchases)b | Statement of revenues, expenditures, and changes in fund balances | |
a . Intergovernmental revenue includes restricted and unrestricted .
b . Debt service may be part of expenditures, may be a transfer to the debt service fund, or may be both .
Service obligation is the first financial dimension for evaluating the resource flow for governmental funds. The operations ratio, representing total revenues divided by total expenditures, is used to analyze this dimension. The data for this calculation come directly from the statement of revenues, expenditures, and changes in fund balances, and a ratio of 1.0 or higher indicates that a government lived within its means.
Transfers out are not part of this calculation unless the transfer is to a debt-service fund. GAAP also require governmental funds to report the present value of the minimum payments on capital leases or installment purchases as an expenditure in the year of an agreement’s inception. If total expenditures do include this amount (as would be evidenced by another financing source of an equal amount), they should not be included for purposes of this calculation and should be subtracted from total expenditures.
The remaining two dimensions capture important aspects of revenues and expenditures. Dependency is used to determine the extent to which governments rely on other governments for resources, as measured by the intergovernmental ratio indicator: intergovernmental revenue divided by total revenue. Financing obligation is used to provide feedback on service flexibility by measuring, with the debt service ratio indicator, the amount of resources committed to annual debt obligations. If transfers to a debt-service fund have been made by the governmental fund, the transfer should be included in both the numerator and the denominator.
We selected three financial dimensions and three financial indicators for evaluating resource stock for governmental funds as shown in Table 18.4. The financial dimension of liquidity uses the quick ratio indicator, which follows the same philosophy and calculation as the liquidity dimension for government-wide activities and enterprise funds.
Table 18.4. Resource Stock for General Fund—Balance Sheet (Financial Resources and Modified Accrual Basis of Accounting)
| Financial Dimension | Description | Financial Indicator | Calculation | Data Source | |
| Liquidity | Government’s ability to address short-term obligations . | Quick ratio | Cash and investments divided by current liabilitiesa | Balance sheet | |
| Solvency | Government’s ability to address long-term obligations . | Fund balance as a percentage of expenditures | Available fund balance divided by total expenditures (less proceeds from capital leases) plus transfers outb | Balance sheet | |
| Leverage | Extent to which a government relies on tax-supported debt . | Debt as a percentage of assessed value | Tax-supported, long-term debt divided by assessed value c | Notes to financial statements d | |
a . Restricted cash is not part of cash and investments for this calculation .
b . G .S . 159-8 defines available fund balance for appropriation as the sum of cash and investments minus the sum of liabilities, encum- brances, and deferred revenues arising from cash receipts .
c . This calculation is the same calculation used by the Local Government Commission when issuing its annual report . Analysis of Debt of North Carolina Counties and Municipalities, where the sum of outstanding general obligation (GO) debt, authorized and unissued GO debt, and installment purchase debt is divided by the assessed property valuation as reported to the N .C . Department of Revenue (NCDOR) (this calculation excludes debt associated with enterprise funds) . This percentage is used as an approximation for the 8 percent of assessed valuation .
d . Tax-supported, long-term debt comes from notes to financial statements . Assessed value comes from NCDOR .
The financial dimension of solvency is evaluated with one of the most recognized financial indicators in local government: fund balance as a percentage of expenditures, as calculated with available fund balance, [see G.S. 159-8(a)], divided by total expenditures plus transfers out. Transfers out is included in the denominator because the Local Government Commission standardizes available fund balance for comparison purposes by dividing it by expenditures and transfers out less the present value of any capital leases or installment purchases entered into during the fiscal year. The calculation of fund balance as a percentage of expenditures presented in this policy follows the calculation of available fund balance as presented in G.S. 159-8; however, see Chapter 3: Fund Balance on the two ways to calculate available fund balance, which include the statutory approach and the GAAP approach.
The final financial dimension for evaluating resource stock for governmental funds is leverage, which is supported with the financial indicator of debt as a percentage of assessed value. The definition of “debt” is tax-supported, long-term debt, which is the amount prepared for a local government’s sworn statement of debt, (G.S. 159-55). The debt is standardized by dividing it by assessed value. State law prevents local governments from issuing debt that would result in net debt exceeding 8 percent of assessed value. [G.S. 159-55(c)]. This financial indicator also plays a major role with bond-rating agencies when they are conducting a general-obligation-rating assignment.
18.6 Leveraging Financial Context
The financial metrics that can assist local governments with the transition from financial position to financial condition must be presented in a financial context to be useful in interpreting results. In other words, one data point in time provides only minimal context when addressing fiscal strength or stress along a selected financial dimension. The first type of context is trend analysis, which requires calculating at least a five-year trend for each financial metric. Using this context, the consumer of the information can determine whether the metric is improving or deteriorating over time. Figure 18.2, for example, contains the debt service ratio for the general fund, showing that the local government is improving its service flexibility by decreasing the amount of resources dedicated to annual debt service as a percent of total expenditures.
Figure 18.2. Debt Service Ratio for the General Fund
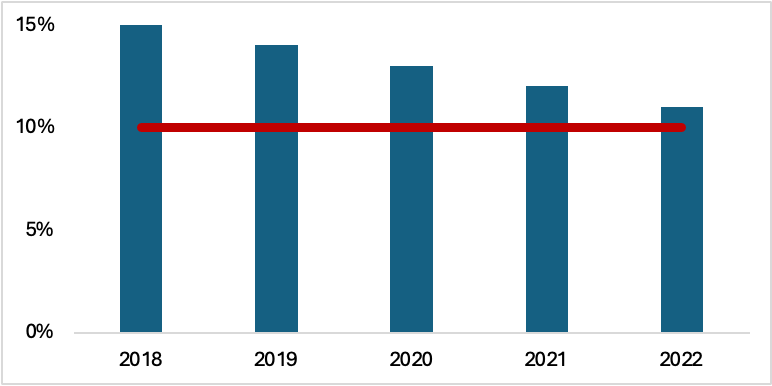
The second type of context is benchmarking, which requires comparing the respective metric against an identified benchmark. There are various approaches to identify the most appropriate benchmark for each financial metric. Some metrics have a natural benchmark—1.0 or above, for example. Other metrics require a benchmark from an internal policy decision, the average from selected benchmark peers (other local governments), or a professional standard from an organization like the Government Finance Officers Association (GFOA). Therefore, the consumer of the information can compare the internal trend, improving or deteriorating, against a predetermined benchmark for additional financial context. Figure 18.2 shows that the debt service ratio remains above the selected benchmark of 10 percent, which is a recognized professional standard for comparative analysis. One possible policy decision that might result from the interpretation of this ratio would be to refrain from issuing additional debt until the debt service ratio is less than the selected benchmark.
18.7 LGC’s Additional Indicators
Returning to the criteria used to create our model for transitioning from financial position to financial condition in local government, the criterion of flexibility acknowledged that administrators might want to augment this approach with additional financial indicators or even replace a financial indicator with another. The LGC has responded to this criterion by revising one financial indicator presented herein and adding two additional financial indicators for analyzing the cash position of water & sewer funds, which is the second most common reason for being placed on the Unit Assistance List (UAL). The first reason is issues of internal control. (See Chapter 1: Introduction to the Local Government Budget and Fiscal Control Act has additional information on the UAL).
The LGC uses a different approach for calculating the quick ratio for enterprise funds by dividing unrestricted cash plus accounts receivables by the sum of accounts payable, accrued liabilities, and current portion of long-term debt. The major difference is that the LGC includes accounts receivables for calculating the numerator of the financial indicator. The LGC’s benchmark is equal to or greater than 1.0. The LGC then uses two additional financial indicators to analyze the cash position of water & sewer funds: operating net income and unrestricted cash ratio. The operating net income indicator is calculated by subtracting operating expenses (less depreciation plus principal and interest) from operating revenues. The LGC’s benchmark is greater than zero. The unrestricted cash ratio indicator is calculated by unrestricted cash divided by total expenses (less depreciation plus principal). The LGC’s benchmark is 16 percent or greater. See LOCAL GOVERNMENT COMMISSION, FPIC Sample Responses and Resources (detailing their quick ratio, operating net income, and unrestricted cash ration calculations and benchmarks).
18.8 Conclusion
Again, administrators may see the need to adjust this policy’s approach to analyzing the financial condition of their respective local governments. As stated earlier, there is no one professionally recognized approach for transitioning from financial position to financial condition in local government. However, the purpose of this policy is to give administrators a fundamental starting point for providing elected officials with criterial information on how a local government’s financial condition is changing over time. Based on interpreting the trends and benchmarks of financial indicators, policy decisions can be made during the annual budget process to strengthen the local government’s financial condition to meet its ongoing financial, service, and capital obligations based on the status of resource flow and stock as interpreted from its annual financial statements.